Main Screen
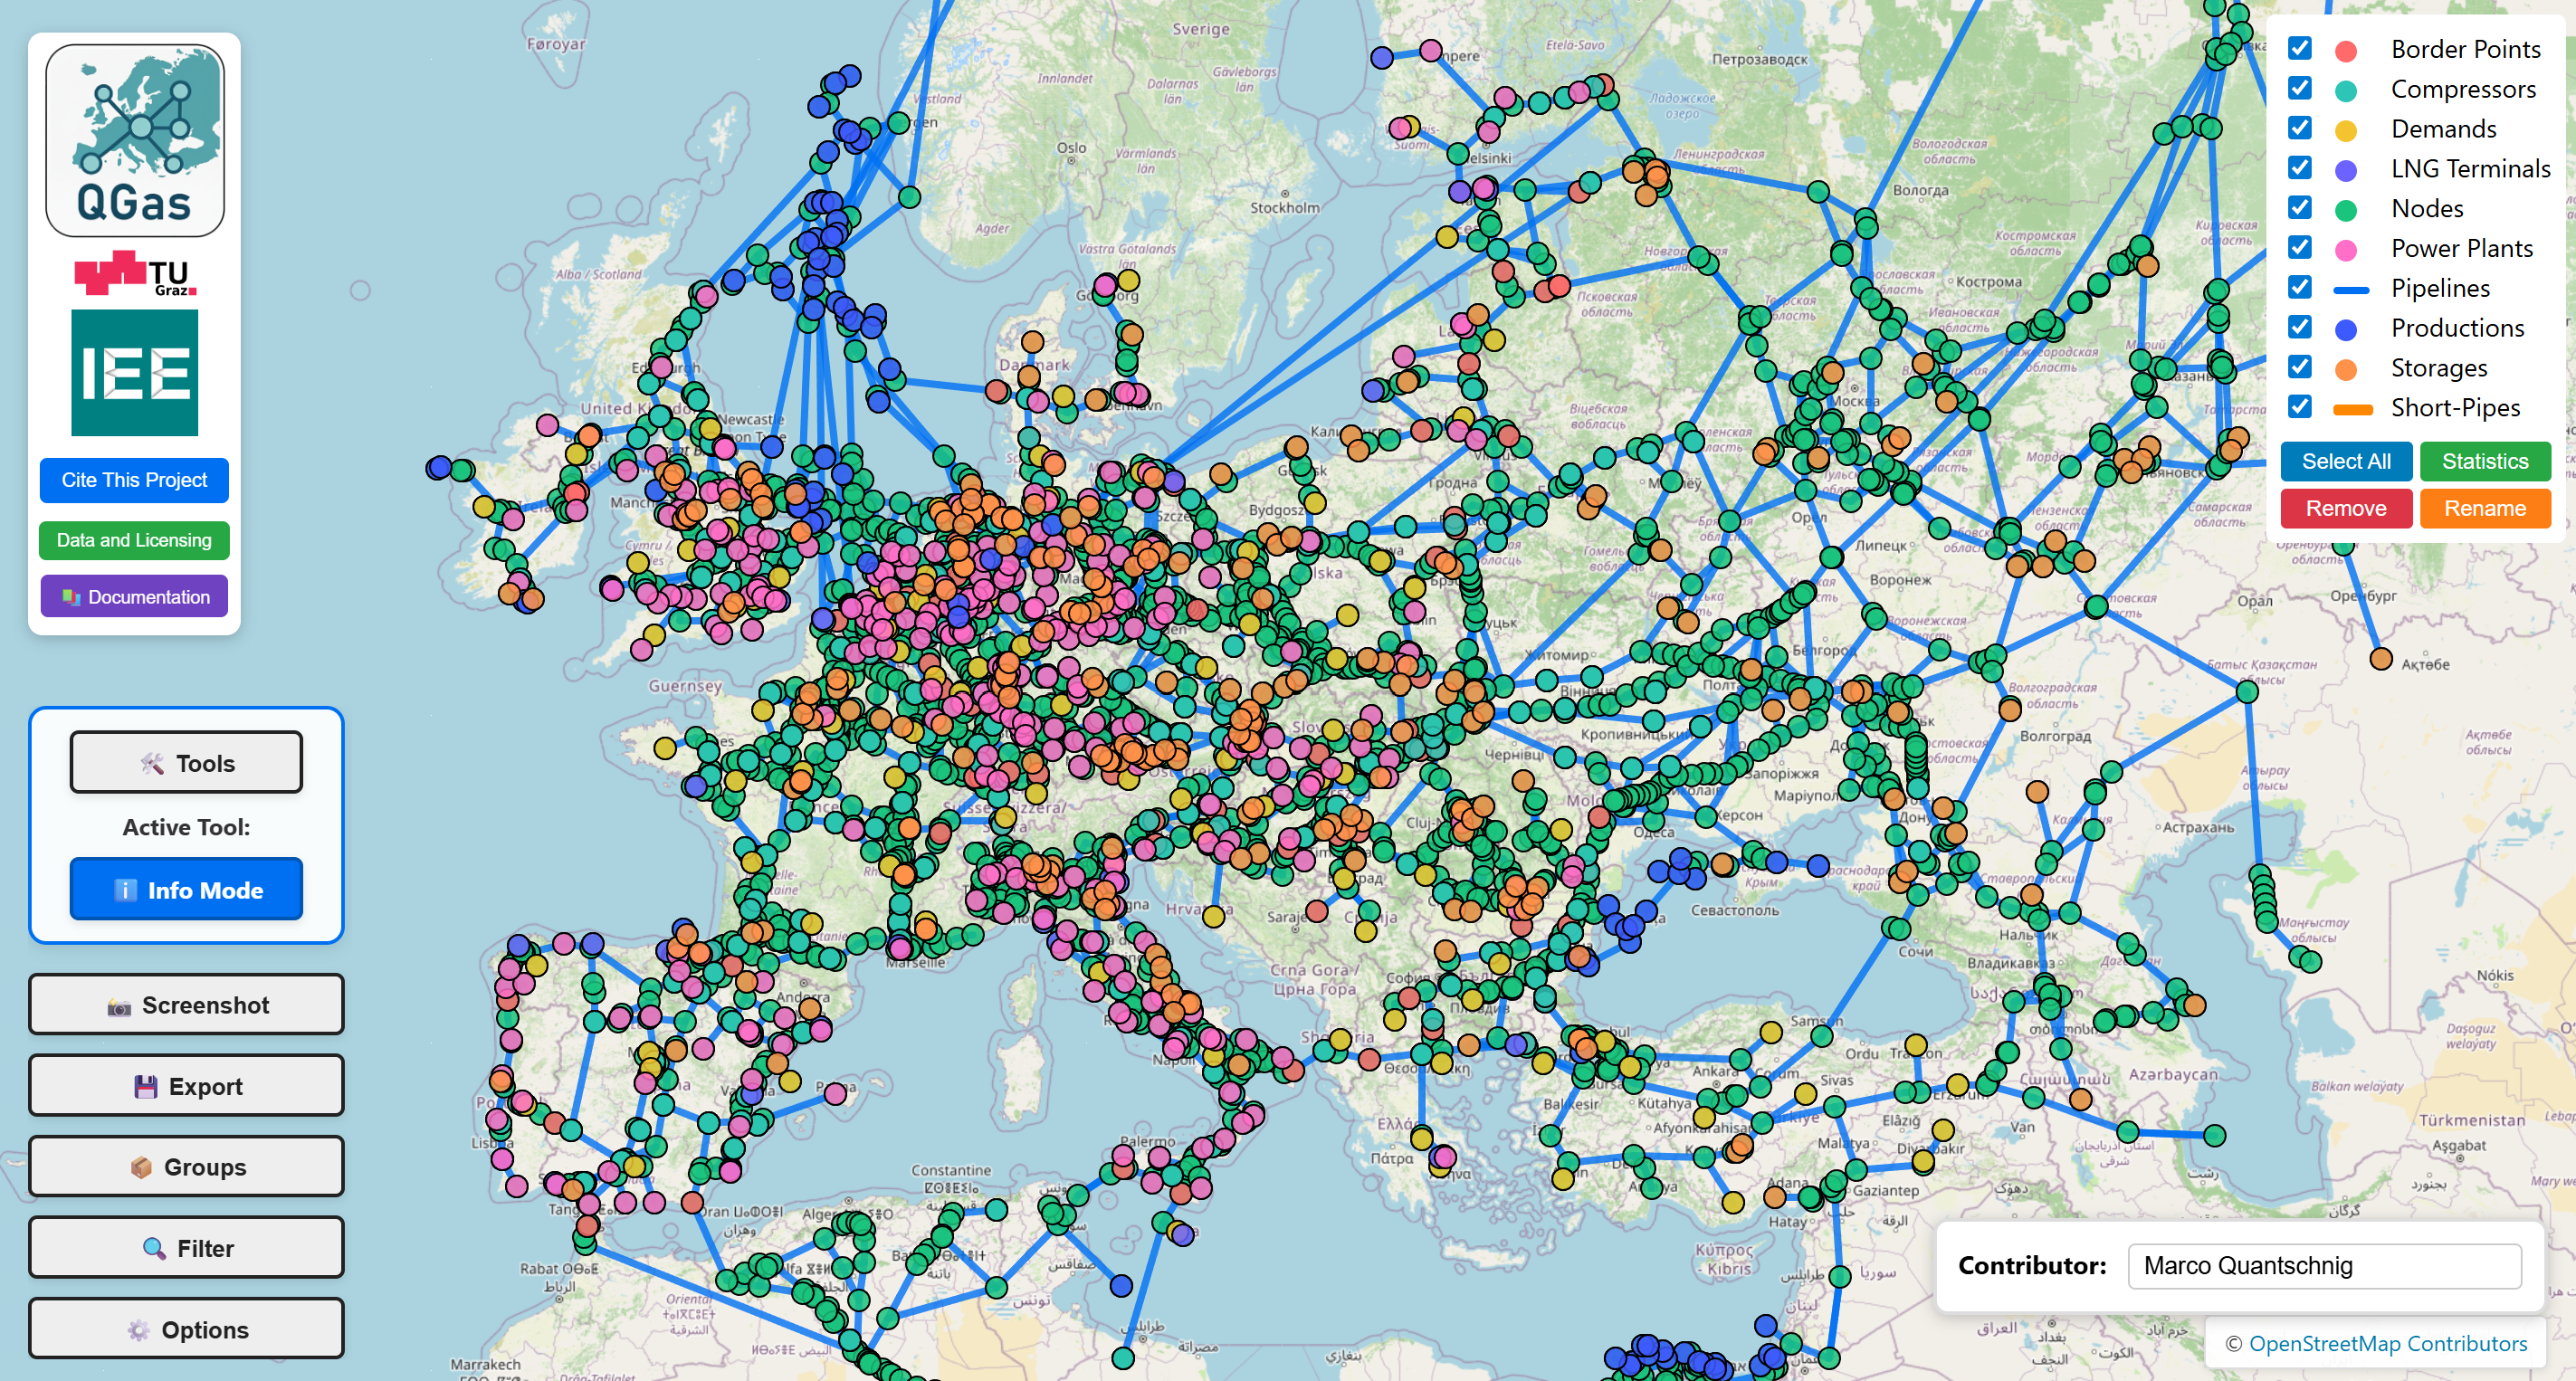
After the startup process, the user lands on the main screen. The web-based map interface provides an interactive Leaflet.js-based map with comprehensive editing tools. This page describes all major interface elements and their functionality in detail.
Map View
The central element is an interactive map powered by Leaflet.js with OpenStreetMap tiles. Users can pan the map by clicking and dragging, and zoom using the mouse wheel or pinch gestures. The background uses OpenStreetMap standard tiles, which require an internet connection to load.
Top-Left: Logo and Quick Actions
In the top-left corner, you'll find the QGas, TU Graz, and IEE logos for visual identification. Below the logos are three important buttons:
- Cite This Project - Opens a dialog with citation information for academic and professional use.
- Data and Licensing - Displays licensing information specific to the current project, loaded from the project's data licensing file.
- Documentation - Opens this documentation in a new browser tab for quick reference.
Bottom-Left: Main Control Panel
The main control panel provides access to all major features through a series of buttons and displays.
Tools Section
Tools Button - Clicking this button opens a comprehensive toolbox popup containing 15+ specialized editing tools. The tools are organized in a grid layout and include options for viewing, editing, creating, modifying, and integrating infrastructure data. All tools are described in detail in the Toolkit / Tools section of this documentation.
Active Tool Display - Below the Tools button, the currently selected tool is displayed (e.g., "Info Mode"). This provides immediate feedback about which tool is active.
Main Action Buttons
Screenshot - Activates clean screenshot mode, which hides all UI elements, control panels, and the legend. This mode is designed to generate clean maps suitable for publications or presentations. Press ESC to exit screenshot mode.
Export - Opens the export dialog, which offers three export modes:
- Export Complete Dataset - Exports the entire project as a ZIP file, including all GeoJSON files while preserving the directory structure.
- Export Filtered Data - Exports only the currently visible or filtered elements, useful for extracting country-specific data.
- Export Changes - Exports only modified elements with contributor information, useful for tracking and reviewing edits.
Groups - Opens the Groups panel, which provides an overview of all grouped pipeline elements. When clicking on a group in this panel, all corresponding elements are highlighted and centered on the screen. The panel shows the total length and member count for each group.
Filter - Opens the Filter panel, which allows filtering the dataset based on geographical features such as country information. Users can select countries using multi-select checkboxes. The panel includes Clear Filters and Apply buttons for managing filter states.
Options - Opens the Options panel for customizing the visual appearance of infrastructure types. This includes:
- Color Picker - Change colors for each infrastructure layer
- Size Controls - Adjust marker sizes for point elements
- Line Width - Modify pipeline thickness
- Pattern Selection - Choose line styles (solid, dashed, dotted)
- Monochromatic Mode - Toggle grayscale background map, useful for presentations or printing
Right Side: Legend
The Legend panel lists all available layers for the currently selected project. Each layer has a checkbox to toggle its visibility on the map. Layers added through Add New Element, Switch to Sublayer, Integrate Dataset, or Add Infrastructure Plans also appear here automatically.
At the bottom of the legend there is a row of four buttons arranged in a 2×2 grid:
- Select All – Toggles all infrastructure layers on or off simultaneously.
- Statistics – Opens the analytics window (see below).
- Remove – Activates Remove Mode. While active, each legend entry shows a red ✕ indicator. Clicking an entry permanently removes that layer and all its elements from the project. Click Remove again to exit the mode.
- Rename – Activates Rename Mode. While active, clicking on any layer name opens an inline text field to change the display name. Confirm with Enter or by clicking away. Click Rename again to exit the mode.
The legend updates in real-time.
Statistics Button
Located directly below the legend, the Statistics button opens a comprehensive analytics window showing:
Element Counts
- Number of pipelines, nodes, and facilities broken down by infrastructure type
- Breakdown by infrastructure category
Pipeline Statistics
- Total Length - Sum of all pipeline lengths in the project
- Length by Type - Breakdown by pipeline category
- Attribute Coverage - Percentage of elements with key attributes such as diameter availability, maximum pressure availability, and other custom attributes
Visual Charts
- Bar charts for element distribution
- Pie charts for attribute completeness
- Length distribution histograms
The statistics update automatically when changes are made to the underlying dataset, such as adding new elements or modifying pipeline lengths.
Bottom-Right: Contributor Box and Attribution
Contributor Input Box - Text field where users can enter their name to track who made which changes. Each modification is tagged with the entered contributor name, enabling proper attribution and change tracking.
OSM Attribution - OpenStreetMap copyright notice, which is always visible as required by the OpenStreetMap license.
Tools Popup
Clicking the Tools button opens a comprehensive toolbox with 15+ specialized tools organized in a grid. The tools are categorized as follows:
Basic Tools
- Info Mode - View and edit element attributes in a popup dialog
- Edit Geometry - Move nodes or reshape pipeline routes by dragging vertices
Creation Tools
- Add Pipeline - Draw new pipeline segments by placing vertices
- Add Infrastructure - Place new facilities such as LNG terminals, storage units, or power plants
- Add New Element - Create entirely new layer types with custom attributes
Modification Tools
- Change Direction - Reverse pipeline flow direction by swapping start and end nodes
- Short-Pipe - Mark short connecting pipes with special attributes (9999mm diameter, 0m length)
- Delete - Remove selected elements from the dataset
- Divide Pipeline - Split a single pipeline into multiple segments
Advanced Tools
- Group Pipelines - Virtually group different segments of a single physical pipeline for coordinated management
- Switch to Sublayer - Move elements from a parent layer to a sublayer (e.g., for hydrogen repurposing scenarios)
- Split Node - Separate overlapping connections by creating multiple sub-nodes at the same location
- Reconnect Infrastructure - Change which network node an infrastructure element is connected to
- Distribute Compressors - Split aggregated compressor stations into multiple substations with averaged power values
Integration Tools
- Add Infrastructure Plans - Import infrastructure plan images, georeference them using control points, and use them as a semi-transparent background for tracing
- Integrate Dataset - Import a full QGas project or a single GeoJSON layer into the active project (with interactive layer mapping and attribute merging), or interactively pair pipeline segments between two datasets for attribute transfer
Each tool provides specific prompts and visual feedback to guide users through the editing process. Detailed descriptions of all tools are available in the Toolkit / Tools section.
Keyboard Shortcuts
- ESC - Exit current mode (screenshot mode, tool mode, etc.)
- Ctrl + Mouse Wheel - Zoom the map
- Ctrl + F5 - Hard refresh to clear browser cache