Interface Overview
QGas consists of a Desktop GUI for server management and a web-based map interface for data visualization and editing. This overview provides a brief description of each interface element.
Desktop GUI
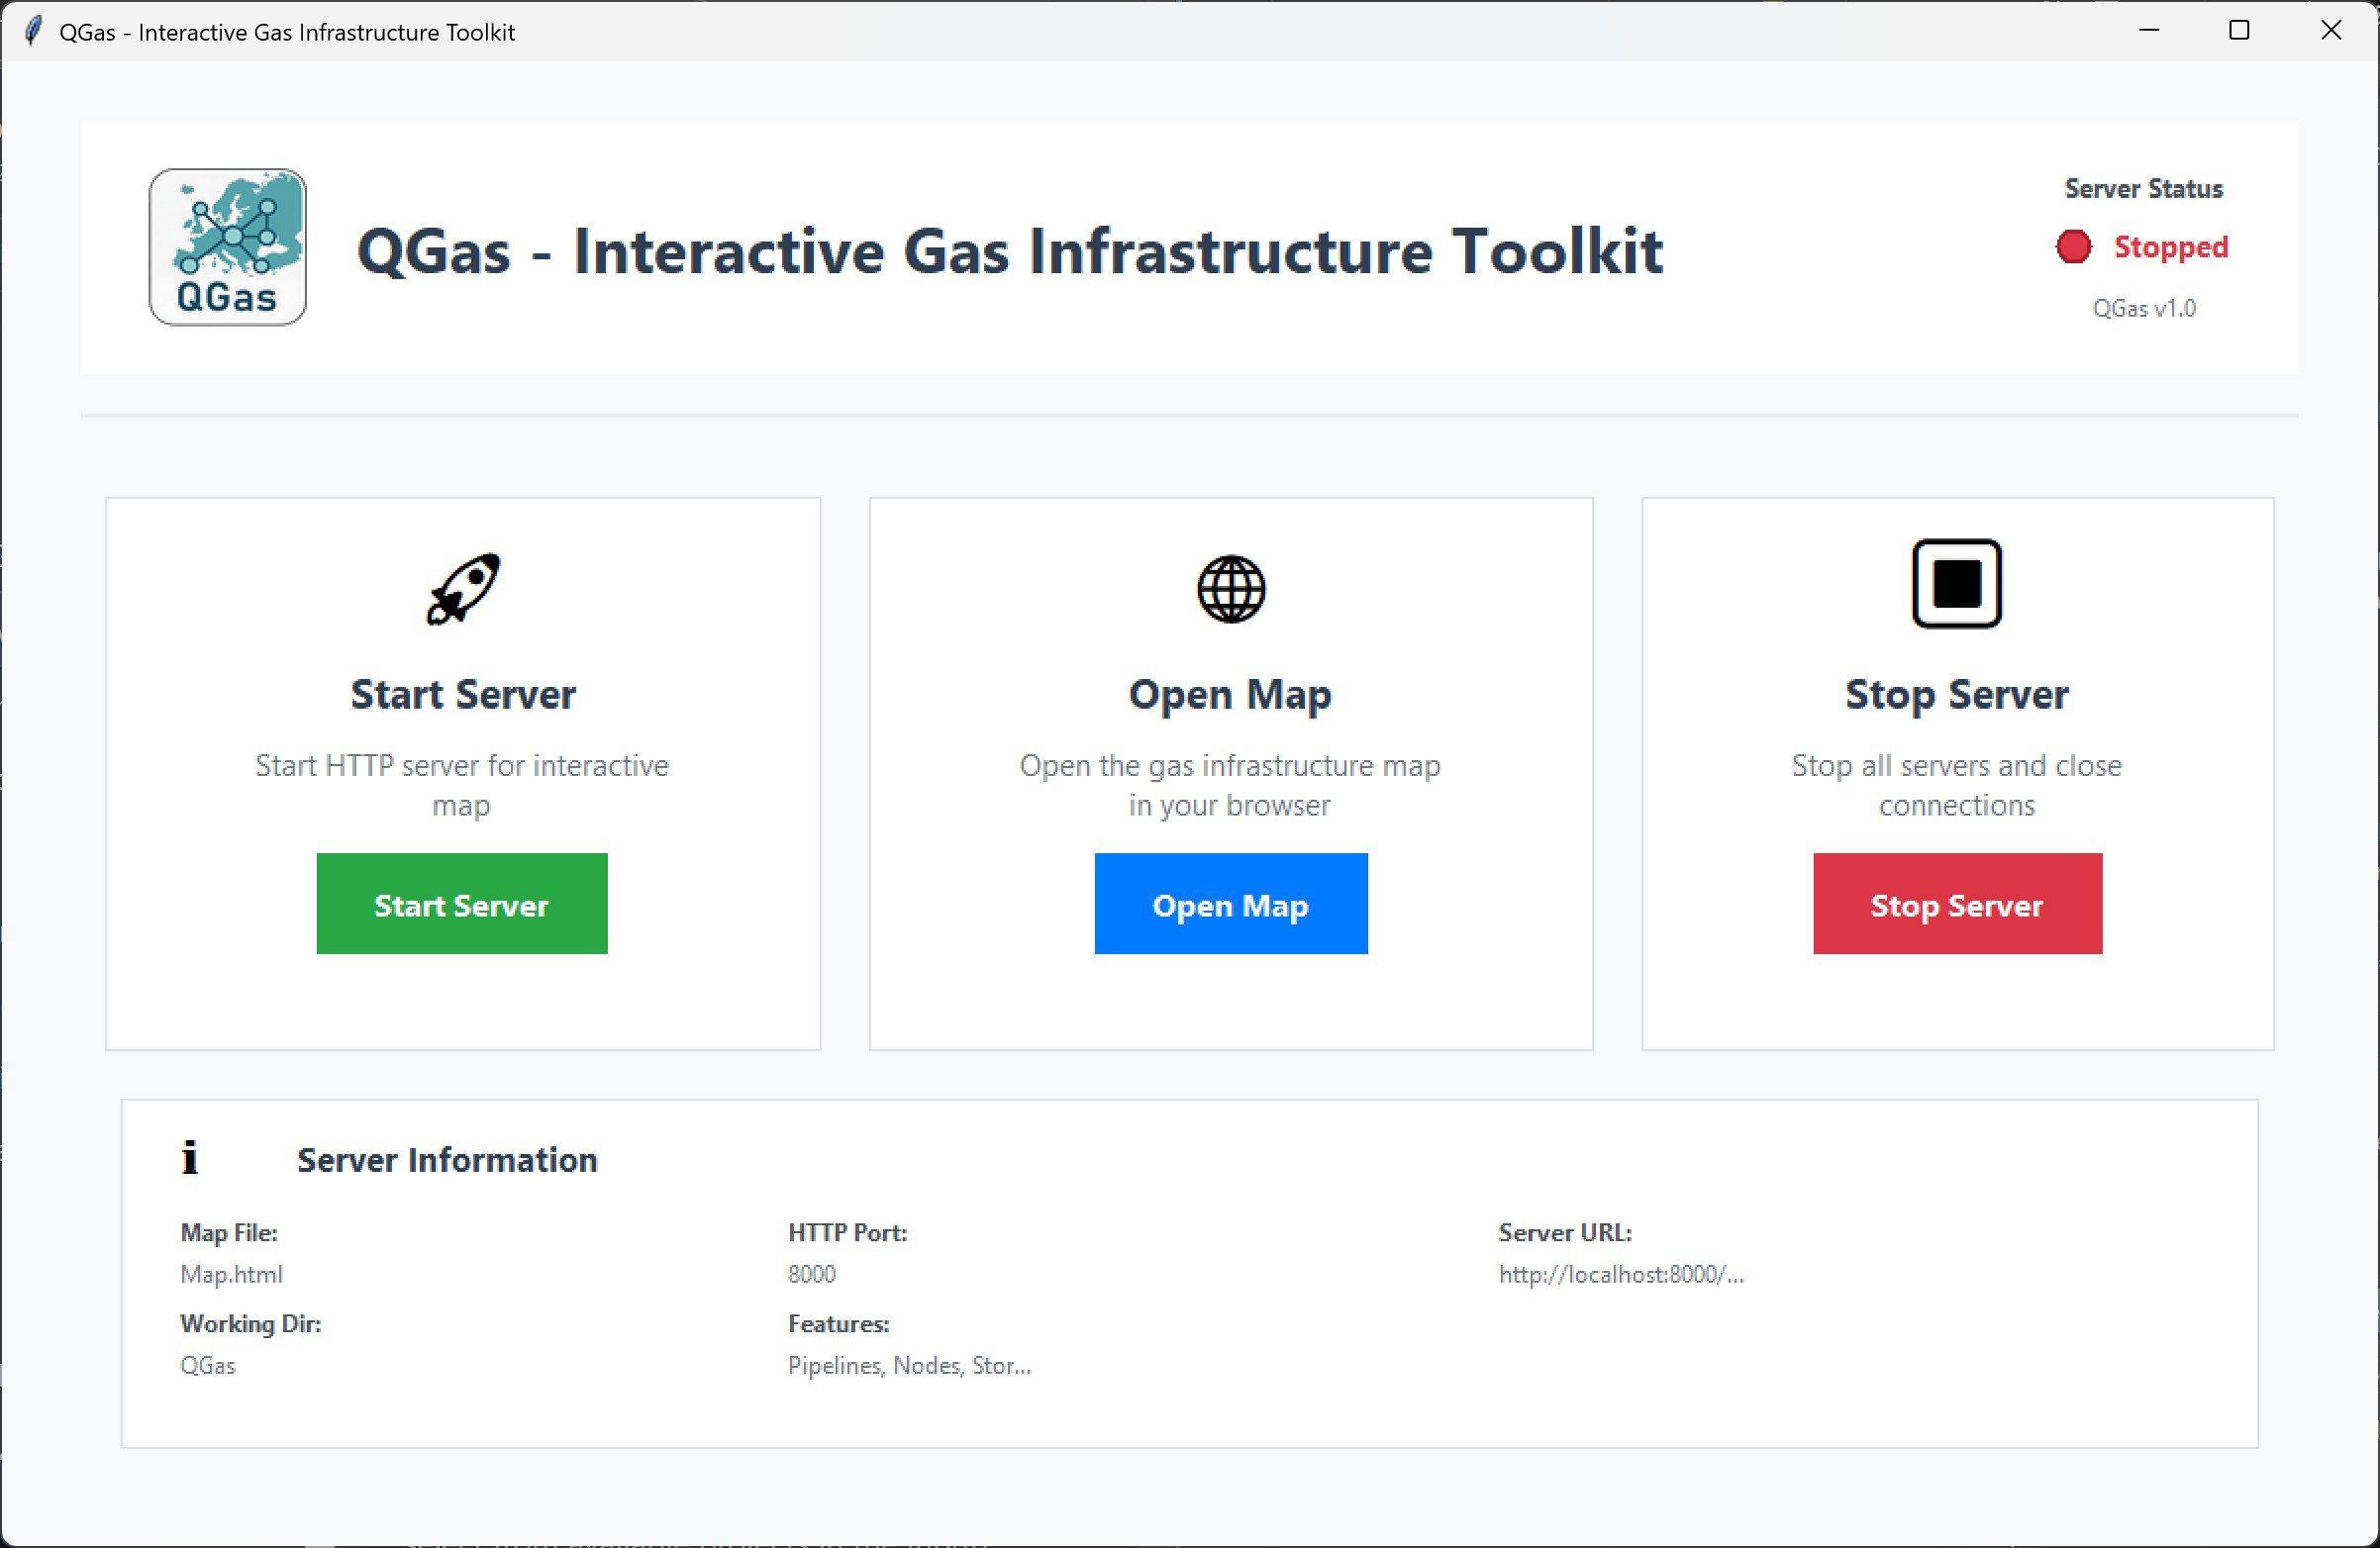
QGas Logo and Branding - Displays TU Graz and IEE logos with version information.
Server Status LED - Real-time indicator showing server status (red = stopped, green = running).
Start Server Button - Initializes the HTTP server on port 8000.
Open Map Button - Launches the interactive map interface in the default web browser.
Stop Server Button - Safely shuts down all server connections.
Information Panel - Displays technical details including ports, URLs, and working directory.
Project Selection Dialog - Dropdown menu to select from available projects in the Input/ folder.
Web Interface
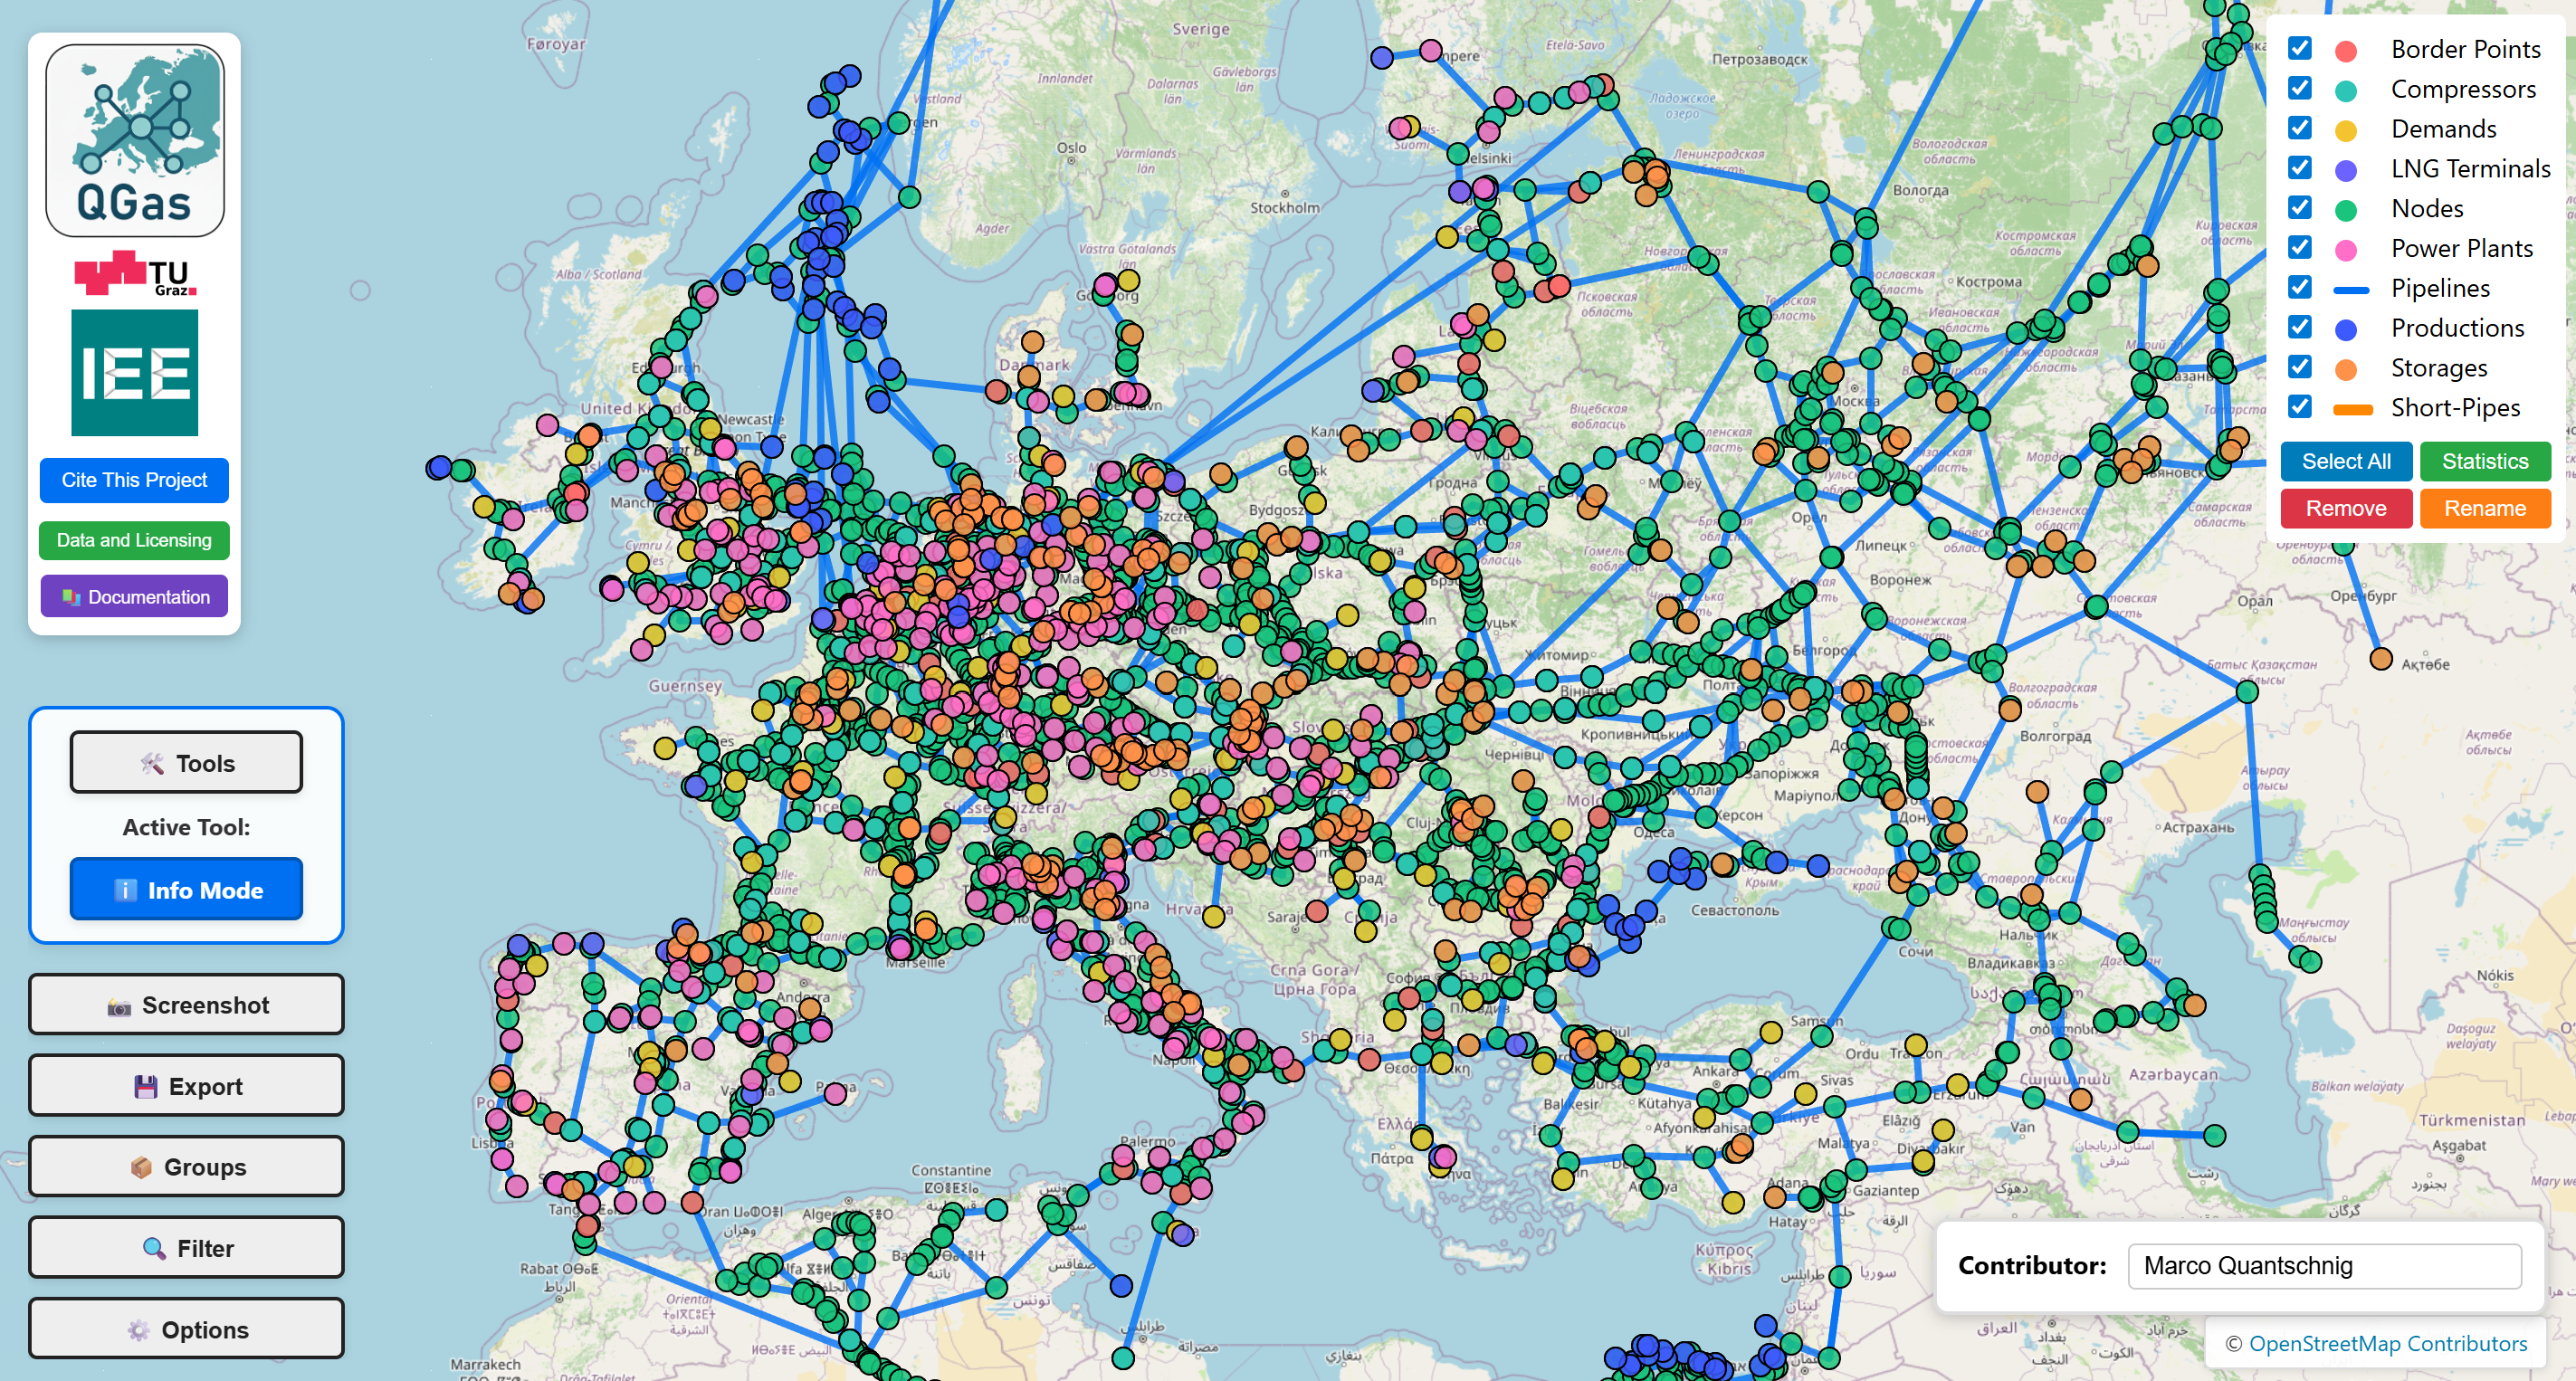
Interactive Map - Leaflet.js-based map with OpenStreetMap tiles for panning and zooming.
Logos (Top-Left) - Visual branding elements for QGas, TU Graz, and IEE.
Cite This Project Button - Opens citation information dialog.
Data and Licensing Button - Displays licensing information for the current project.
Documentation Button - Opens this documentation in a new browser tab.
Tools Button - Opens the comprehensive toolbox popup with 15+ specialized editing tools.
Active Tool Display - Shows the currently selected tool below the Tools button.
Screenshot Button - Activates clean screenshot mode by hiding all UI elements.
Export Button - Opens export dialog with three modes: complete dataset, filtered data, or changes only.
Groups Button - Opens panel to view and manage grouped pipeline segments.
Filter Button - Opens panel to filter data by country or other geographical attributes.
Options Button - Opens customization panel for colors, sizes, and map styling.
Legend Panel - Shows all infrastructure types with checkboxes to toggle visibility.
Select All Button - Toggles all legend layers on or off simultaneously.
Statistics Button - Opens statistical overview window with element counts and pipeline analytics.
Remove Button - Activates Remove Mode; clicking a legend entry permanently deletes that layer from the project.
Rename Button - Activates Rename Mode; clicking a layer name opens an inline editor to change its display name.
Contributor Input Box - Text field to enter contributor name for tracking changes.
OSM Attribution - OpenStreetMap copyright notice in the bottom-right corner.
Keyboard Shortcuts
- ESC - Exit current mode (screenshot, tool, etc.)
- Ctrl + Mouse Wheel - Zoom map
- Ctrl + F5 - Hard refresh (clear cache)
Start with Info Mode to explore the dataset. Click on various elements to see their attributes and understand the data structure before making modifications.